ElasticSearch on K8s: 01 — Basic Design
How to setup a minimal but useful Elastic Stack on K8s

Log aggregation in a K8s environment is something I have lightly touched upon previously in multiple occasions. However setting up a minimal but a reliable log aggregation stack on top of K8s could quickly become an evolutionary process with each step improving on the previous one (and of course, everyone thinks they can do log aggregation before they actually start to do so). The following is a pattern for ELK I came across while improving such a stack. While this pattern addresses most common requirements for a native K8s log aggregation stack, there could be better, more suitable patterns that you may have to consider when setting up solutions of your own.
Bird’s eye view
Problem
To discuss a solution, let’s first define a sample problem.
In our sample scenario, there is are one or more user managed (in contrast to provider managed) K8s clusters running on a popular Cloud Service Provider (ex: AWS EC2). The Nodes are created using different EC2 instance families. Deployment users (ex: infrastructure management team) has direct control over how the EC2 instances are managed.
There are different applications running on the K8s cluster across different namespaces. For some apps, multi-tenancy is implemented using K8s Namespaces as a basis, and some have multi-tenancy built-in to the code so that a single cluster of apps could be aware of multiple tenants acting on them.
The CNI could be the default flannel deployment or a more specialized customized deployment such as weave where network boundaries are implemented using NetworkPolicies.
Storage Classes are defined for the Cloud Service Provider provided persistence options (ex: EBS).
The logs generated by different apps in different Namespaces should be aggregated and indexed for analysis. The aggregated logs should be available for a predefined set of users with SSO through the chosen IDP for the deployment.
Solution
The solution for the above problem is a stack that looks logically similar to the diagram below. The responsibility of this stack of tools is to collect, enrich, store and provide convenient access to the logs.

Each component of the stack are deployed in the same K8s cluster from where the logs are collected (this isn’t a must, a different controller K8s cluster could be used for log aggregation altogether).
In the above diagram, each blue box is a compute workload of the K8s native format Pod .
Their life cycles are controlled by various K8s native controller implementations, Deployment , StatefulSet , or DaemonSet . These controllers are represented by grey boxes.
The green boxes represent the K8s constructs that deal with data persistence. They include PersistentVolumes and PersistentVolumeClaimTemplates . They ultimately result in whatever the Cloud Service Provider specific implementations for storage, ex: EBS volumes for AWS.
The white boxes represent the networking constructs in K8s that act as consistent naming and service discovery, namely Services . Various types of Services are used in this deployment depending on the requirement, that could include load balancing, consistent naming, or reverse proxying.
Note that,
- Only Logstash and ElasticSearch processes need persistence
- Only Kibana is exposed to outside traffic
- ElasticSearch makes use of two types of Services
In addition to the above, there could be components that make authentication and authorization happen. To keep the scope of this article series simple, they are not included in the basic setup.
Let’s dive into the details of each component now to understand the function of each box in the above diagram and a few quirks of the design.
ELK Stack Components
A typical log collection stack consists of components for
- log collection
- log enrichment
- log storage and indexing
- visualization
While various tools offered by both Elastic and other vendors could work together in the above layers, most common tools used are,
- some kind of a Beats agent, ex: filebeat
- Logstash
- ElasticSearch
- Kibana
Log collection
The typical task for a log collection tool is to collect a specified set of logs, from a specified set of locations, and offload them to a specified endpoint. Let’s explore these three aspects in detail.
In a K8s environment, all logs of interest are produced as Docker Container logs that collect each Container’s stdout. These logs are persisted in each node, typically in /var/lib/docker/containers/ folder.
Various tools have functionality OOTB that can collect logs entries from these Container log files. In Filebeat’s case it is a matter of specifying the type of input for collection as docker. What this does is to instruct Filebeat to collect the logs from the above mentioned Docker Container log file path.
It should be noted that Elastic now favors
containertype todockertype, however the input parameters are more or less the same.
There are additional options that can be tweaked in order to modify the default behavior Filebeat uses to collect Docker logs. These include the containers.ids , containers.stream , and json . Filebeat documentation explains how these can be employed, however most defaults will do for the use case we are considering.
This configuration will start collecting the Docker Container logs. However the resulting log event will only consist of the data collected off from the log file itself. There are other information that could be collected that could be meaningful at the end of the pipeline. For an example, it’s important to understand which Pod produced a particular log line on which specific AWS instance containing a specific tag. Although it may be possible to enrich each log event later by means of correlation, Filebeat provides Processorsto configure enrichment easily.
Two processors if importance in this setup are the Cloud Metadata Processor and the K8s Metadata Processor. Adding these to the configuration will make sure Cloud Service Provider specific details like the instance ID, region, and availability zone, and K8s cluster specific details like originating Pod name, Pod labels and Namespace are included in each resulting log event as Fields to be manipulated later (interestingly this is a form of log enrichment before we actually reach the tool designed to do log enrichment). These Fields will be highly useful to setup proper data segregation, search, and visualization.
Now that how to collect logs is specified using a proper configuration, the locations to collect logs from has to be figured out.
In this case, Filebeat has to be run in background in the compute Nodes that are running K8s. This has to be a constantly running process that repeatedly polls the log files for new inputs.
We can start Filebeat as a typical Pod, may be as part of a Deployment. However, deploying Filebeat as a Deployment type opens up a critical hole in the design.
While a Deployment may schedule its Pods as it wishes, based on resource availability and other factors such as taints and tolerances, that would result in some compute Nodes not having a Filebeat Pod running in them to collect the Docker logs. To make sure that a Filebeat Pod is scheduled on each and every Node another K8s construct called DaemonSet has to be used. A DaemonSet makes sure that the Filebeat Pods are scheduled in every Node with a count of 1.
The configuration to mount to the Filebeat Pod may look like the one below. Again, this is a minimal configuration matching a minimal requirement set. It’s highly likely this will require modification before getting adapted to specific deployments
TODO
Now that how the logs should be collected and where log collection should happen are specified, the last piece of configuration to attach to the above is the destination for the logs that are read off from the Docker Container logs.
In our stack defined above, this destination is the log enrichment layer, where Logstash is running. For Filebeat to publish logs to Logstash, the K8s Service for Logstash can be used. If Filebeat and Logstash are deployed in the same K8s Namespace, just the Service name logstash can be specified. If Logstash is in a different Namespace, the FQDN of logstash.<namespaces>.svc.cluster.local has to be used to resolve the Service name correctly.
There will be more configuration to set up for a proper production deployment requirement. Let’s revisit them at the end, without complicating the explanation at this moment.
TODO: need for filebeat SA

Note that we have not specified any persistence for the Filebeat Pods. Since Filebeat only does log collection to be sent off to enrichment, and since the logs can be retrieved from the source if needed (during a limited period of time), Pods do not need a persistence layer to retrieve data in the case of crashes.
Log enrichment
Now that the logs are being collected from the required sources, it’s time to start making meaning out of them. This part of the process is called enrichment, and Logstash is the tool of choice in our stack.
In brief, Logstash is a customizable pipeline that each incoming event goes through. A pipeline can have different types of inputsdefined. beats is the type of input that we are interested in, that will allow our Filebeat agents to push collected logs to Logstash. Defining an input for beats opens up a port on the host Logstash is running on so that Filebeat agents are able to connect to that port and send over the logs.
There are other types of inputs that can be defined, including
file,s3, andelasticsearchbeing a few interesting ones out of the list.
Log events coming through these inputs are then fed into a pipeline of filters. These filters can modify, delete, clone, or hold (throttle) the log event based on the parameters provided in the filter configuration. The most important of these filters is the grok filter where the incoming log message could be split up to meaningful fields to make sense out of later.
For an example, consider the following log line produced by an Nginx Pod.
TODO
The whole entry has a few meaningful pieces of information huddled together. These are,
TODO
This is the result of the default log pattern produced by Nginx, COMBINEDHTTP . Given the understanding of the log format, we can instruct Logstash to extract the fields out of each Nginx log line.
How this happens is through the use of the grok filter. A pattern to match is given to grok that will try its best to parse the given line. The result is a map of values where keys are fields in the pattern provided to the grok filter, and the values are the matched values in the log line.
Since all sorts of logs generated by different Pods could be fed through Filebeat, we can instruct Logstash to only apply the grok filter to the log events originating from Nginx Pods. We can do this since before publishing the log event, Filebeat has already enriched it with K8s metadata. We can conditionally apply the grok pattern only if kubernetes.labels.appName is equal to nginx (given that the Nginx Pod has a label appName with the value nginx ).
The following information could be parsed from a Nginx log entry with Logstash.
TODO
After the enrichment of the events is done, they can be pushed off to storage. This is also done using a K8s Service that can be addressed just by name or the FQDN depending on the colocation of the respective Namespaces.
This is specified on the output section of the Logstash configuration. Once again, there are different output plugins, but the one we are interested is elasticsearch with which we can push enriched logs to an ElasticSearch cluster. This could also be a basic-auth secured ElasticSearch cluster.
While pushing logs to ElasticSearch, we could also instruct Logstash to push to different indices based on different factors. For an example, in a K8s setup, we could implement some kind of multi-tenancy based data segregation by sending logs from different K8s Namespaces to different ElasticSearch indices. Let’s discuss a sample scenario in another article.

In terms of scheduling the Logstash processes, a Deployment could be used to schedule Pods of Logstash throughout the K8s cluster. This would give flexibility when scaling requirements kick in.
You might have noticed that we have used a StatefulSet with persistence instead of a Deployment in the above diagram. Why this is, has to do with fault tolerance requirements production deployments may have. This is discussed in detail in the last section of this article, where the basic setup has to be modified in order to withstand production level loads.
Log collection and indexing
Now that the logs are translated into a meaningful set of data, it’s time to store and index them for querying. ElasticSearch is the tool of choice, the main attraction of the stack to be honest. It’s an efficient useful tool to store and index unstructured data. How ElasticSearch design, which was done in a time of non-Container-Cluster-Management, is matched to K8s is an interesting story of itself.
In its core, ElasticSearch is only a collection of carefully managed Apache Lucene instances. Each of these Lucene instances is called a Shard in ElasticSearch terms. Typically two of these Shards (one called a primary shard, the other the backup shard) is called an Index. ElasticSearch makes sure to never schedule both of the Shards of the Index in the same ElasticSearch node, to avoid data loss.
I said “typically” because the number of shards per index could vary depending on user preferences. There was a time when 5 shards, 1 primary and 4 backups was suggested as a sensible default. Number of shards per index is best decided early in the design and deployment, as changing this later, when there are a large number of indices to change, would be a hassle.
Other than the number of Shards per index, ElasticSearch requires very little in terms of configuration to startup. However, just one ElasticSearch instance is not considered a healthy cluster, and given that the resource usage of the Shards go up proportionately to the number of requests (that could also go up fairly quickly as we’ll see later), it’s a good idea to scale out from the get go. Furthermore, scaling out an existing ElasticSearch cluster could result in a considerable downtime, since Shards may have to be rebalanced among the new instances of the cluster. So it is important to figure out the cluster requirements before the deployment.
For our sample problem, a 2-node ElasticSearch cluster is enough, although better fault tolerance is achieved with odd numbered clusters, as odd numbers reduce the possibility of split-brain situations at most faulty scenarios. However, for the scope of this article, the configuration that would work for a 2-node cluster will also work for a 3-node cluster.
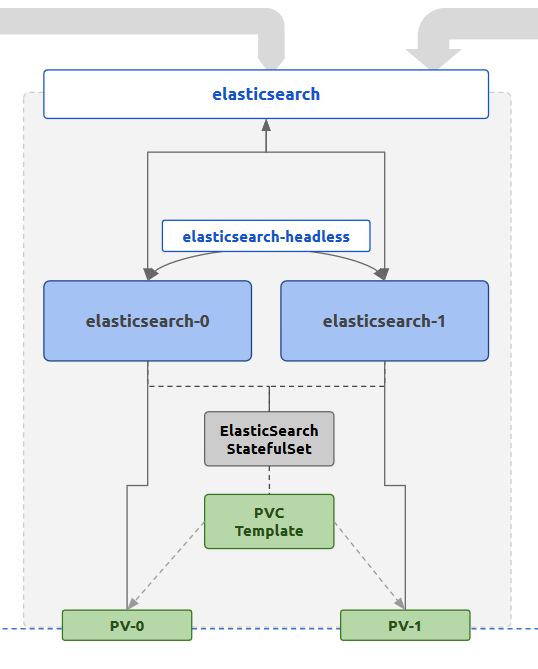
The K8s controller used for the ElasticSearch deployment is a StatefulSet. This is because of the persistence and network consistency that the log persistence tool requires. StatefulSets will schedule Pods in a manner that makes sure in case of Pod downtimes the same resources will be allocated to the newly created Pods during healing. These include any persistent volumes. It also provides a consistent networking through the use of Headless Services where each Pod will have a standard consistent name to be reached. Each Pod is also started in a sequential manner where for a replica count of 3, the start sequence will be pod-0 , pod-1 , pod-2 . Each subsequent Pod will wait until the previous Pod becomes live and running. Together these features provide a sane way of initializing a cluster where node membership is managed by well-known addresses rather than dynamic discovery. For ElasticSearch, the default membership scheme is a mix of the two.
In the StatefulSet, we are also going to define a PersistentVolumeClaimTemplate which generates a PersistentVolumeClaim for each Pod scheduled by the StatefulSet. The allocated PersistentVolume will be mounted to the location which ElasticSearch considers as the data directory, where all data is stored. This is because data should survive beyond Pod lifecycles, or even StatefulSet lifecycles.
In terms of networking, this setup use two K8s Services for ElasticSearch Pods. One is a typical ClusterIP Service named elasticsearch that exposes the ElasticSearch HTTP port, which by default is 9200. This can be used by outside processes (ex: Logstash, Kibana) to reach the ElasticSearch Pods in a load balanced manner. The IPs resolved for each call to the Service name could be the either of the Pod IP addresses.
The other Service is a Headless Service, where the Endpoint objects are created based on Selectors that match the ElasticSearch Pod labels. This is used by the StatefulSet to provide stable network IDs to the Pods through the Service name. For an example, for the sample setup, with a Headless Service named elasticsearch-headless in the default namespace, the two Pods generated by the StatefulSet elasticsearch will be reachable through the FQDN elasticsearch-0.elasticsearch-headless.default.svc.cluster.local . These names can be used for the ElasticSearch configuration to bootstrap the cluster membership. The Headless Service attached to the StatefulSet will expose the clustering port of 9300 in addition to the HTTP port 9200 .
ElasticSearch nodes can play different roles in a cluster depending on the configuration. These roles include,
- data
- ingest
- master
In the sample setup we are discussing, both nodes are playing all the above roles. However, for a given cluster, there can be only one master node and all others nodes that hope to become one will have to be master eligible.
When an ElasticSearch cluster is first booted up, two tasks have to complete for a master node to be elected.
- cluster bootstrap (one time task that executes the first time the cluster nodes start up), where the first round of master eligible nodes (whose votes will be used for master election) are explicitly looked for
- discovery of master eligible nodes in the cluster, typically through a load balancing A record resolution
For a K8s setup, the Headless Service features that were described will help to complete both of these tasks.
- In the K8s ElasticSearch setup we are considering, both Pods will be live (determined by the StatefulSet) so both Pods can be used as initial master eligible nodes. Since Headless Services provide consistent naming for both of the Pods, the names
elasticsearch-0andelasticsearch-1can be used for the related settingcluster.initial_master_nodes. The cluster when starting up for the first time, will consider the votes of both of these Pods and proceed with the master election. - When another master election comes (cluster restart, master going offline), there has to be a method to discover newly joined Pods which are master eligible. In this case, any new Pods created as a result of scaling out will have to be discovered in order for election process to proceed. This can be done through the use of the Headless Service name, which when resolved will return all the Pod addresses (in contrast to a typical ClusterIP Service which will return only the Cluster IP address when resolved). Therefore, for the related setting
discovery.seed_hosts, the Headless Service nameelasticsearch-headlesscan be provided.
Since these names are known before the Pods are actually spawned, including them in a ConfigMap and making ElasticSearch Pods use that configuration is possible. This would not have been the case if a Deployment or a typical Service were used in place of the StatefulSet or the Headless Service.
With the successful and healthy GREEN ElasticSearch cluster, the data pushed from Logstash will correctly be stored and indexed. Now these can be queried for all kinds of purposes, through either the ElasticSearch REST API or the visualization tool, Kibana.
Visualization
Kibana is a web application which can be used to query data from an ElasticSearch cluster. It does so through issuing queries to the ElasticSearch cluster through the REST API. Additionally it also acts as a widget and dashboard server that can be used to visualize specific queries, as well as a management frontend that can perform several actions like role and user management that are a lot cumbersome to do so through the ElasticSearch REST API. Kibana itself doesn’t have a requirement for persistence as it uses ElasticSearch itself as a persistence layer.
Being a web application, Kibana is the only tool out of this stack that has to be exposed to outside traffic in typical conditions. Therefore, the attached kibana Service is linked to an Nginx Ingress which then can be exposed through a Cloud Service Provider load balancer.
Exposing the stack to outside traffic inevitably means that some kind of application level authentication and authorization will have to be put in place. This will be discussed in a future article.

Since there are no special requirements for scheduling when it comes to Kibana, a typical K8s Deployment can be used to spawn Pods. As it turns out, this will also be the layer with the lowest user generated load (mostly because Kibana will be used during the time of an abnormal behavior in the system, which ideally should be rare, and because the bulk of the effective load for a request is done at the ElasticSearch layer). Furthermore, being stateless on its own (since ElasticSearch is its persistence), Kibana Pods can be scaled up and down as desired without having to worry about persistence requirement.
Gluing the stack together
Now that we have discussed each tool of the stack in detail, let’s take a closer look at how these components interact with each other.
Looking back at the first diagram which shows the complete logical deployment of the stack, the interactions between the components can be broken down to the following.
- Filebeat talks to Logstash through the K8s Service
logstashthrough port5066to push collected logs - Logstash talks to ElasticSearch through the K8s Service
elasticsearchthrough the port9200to push enriched logs - ElasticSearch nodes in the cluster talk to each other using the K8s Headless Service
elasticsearch-headlessand the consistent Pod names through the port9300to form and maintain the cluster - Kibana, when the user initiates access, talks to ElasticSearch through the K8s Service
elasticsearchthrough the HTTP port9200to read and write data
The definitions of the Services mentioned above should reflect this by exposing the correct ports for communication. Furthermore, any NetworkPolicy definitions put in place should allow ingress and egress traffic from the parties defined in the above interactions.
For an example, when considering the interactions #2, #3, and #4, the NetworkPolicy attached to the ElasticSearch Pods should allow ingress traffic to port 9200 originating from labels attached to both Logstash and Kibana Pods. On the other hand, it should also restrict traffic to port 9300 so that only traffic originating from labels attached ElasticSearch.
kibana Service should be exposed to outside traffic using an Nginx Ingress and attached Cloud Service Provider load balancers. The port that the Service should expose is 5601 .
The above considerations should take care of most of the issues in connectivity between the Pods of the stack. However, this stack would not be ideal to be left out in the production environment. There will be layers that will easily buckle before sudden spikes or consistent high loads. They should be hardened in terms of fault tolerance.
Buffering at Logstash Layer (Part 01)
Filebeat and Logstash are essentially the content input and transformation layers of the stack. Therefore, naturally, the first line of defense against unwanted levels of input should be implemented at these layers. Implementing this at Filebeat could be simpler, excluding file patterns that may produce a large number of log lines per second, however that is not a proper adaptive defense against sources that unexpectedly send too large inputs, that otherwise may produce meaningful data. Therefore, it may be better to keep the complexity of buffering input away from Filebeat.
Logstash on the other hand could get affected first by a spike of input. “Persistent Queues” (PQs) is a built-in feature for Logstash to tackle this exact problem. In brief, Logstash instances with PQs enabled will keep a configurable file based buffer (instead of a fixed in-memory buffer) for incoming events to be processed. Events will clear this buffer only after being fully processed (i.e. going through filterand/or outputstages, based on ACKnowledging the event to Filebeat as processed). If the buffer is filled at a certain points (ex: by a spike of inputs from one of the Filebeat instances) that Logstash instance will stop accepting events for processing, until the buffer is cleared to queue more input. This method of back-pressuring inputs lets Logstash gracefully fail during a spike, without dropping events.
PQs can be configured to have both a maximum event count and a maximum size on disk. Therefore, the buffer size can be experimented with to have the optimum size for managing back-pressure in a sensible manner.
For PQs, durability is important, and therefore, storing the PQs on a Pod storage, which does not survive Pod lifecycles, defeats the purpose. PQs should be complemented with Persistent Storage for Logstash. The easiest way to handle this is to convert the Logstash K8s Deployment to a StatefulSet with a PersistentVolumeClaimTemplate . This will make sure that PQs are stored in volumes that will not go down with the Pod or even the StatefulSet controller. This is the reason why Logstash component is portrayed as a StatefulSet managed set of Pods in the initial diagram.

This is only half of the work that can be done to throttle input at the Logstash layer. Let’s discuss the throttle filter approach in another article.
Keeping ElasticSearch Separate
As mentioned in another section, ElasticSearch is the most resource intensive of the tools of this stack. Therefore, it is important to make sure that ElasticSearch Pods are getting adequate resources allocated to it and other non-related workloads are not affecting their performance drastically.
The ideal way to do this is to make sure that
- ElasticSearch Pods get to be scheduled into special types of Nodes with resources matching required performance
- other workloads are not getting scheduled in those special types of Nodes
The K8s native way to implement this is through taints and tolerations. The idea is to
- Spawn special Nodes to match the Pod replica count (ex: 2 in the sample case)
- Mark the Nodes with a taint which is a key-value label
- Mark the
elasticsearchStatefulSet with tolerations that match the taint added to the Nodes
This will make sure that only elasticsearch Pods that carry the matching tolerations, will get scheduled to the tainted Nodes.
For an example, the Nodes that are supposed to host the ElasticSearch Pods can be tainted with the following.
TODO:
The elasticsearch StatefulSet should get the following tolerations.
TODO:
After this change is done the Nodes will only carry the required kube-system Pods and elasticsearch-* Pods that match the tolerations. However, Filebeat Pods should also be scheduled in these Nodes for log collection to be completed. Therefore, the above tolerations that were added to ElasticSearch StatefulSet should also be added to the Filebeat DaemonSet.

With this change, it’s important to match the zones that the PVs will be spawned with the zones that ElasticSearch Nodes will be spawned in. This can be done by defining a
StorageClasswith the provisioner set to the required one (ex:gp2) and usingallowedTopologiesto match the zones. Otherwise, there will be scenarios whereelasticsearchPods will be restricted to Nodes that do not have PVs spawned in that respective zone, failing the scheduling phase.
TODO: storageclass definition with allowed topologies
Managing ElasticSearch JVM Parameters
ElasticSearch is a JVM. Being a memory intensive tool, it should be allocated enough memory so that
- frequency of Garbage Collection is as less as possible
- the Garbage Collection pause is as short as possible
The JVM memory sizes (minimum and maximum) can be set through the use JVM configuration options provided by ElasticSearch. The exact values to set may vary on the type of the use. However as a best practice,
- match minimum and maximum heap sizes (
XmsandXmx) to reduce GC frequency early in the process uptime - match the Pod memory requests and limits to the heap size
Since ElasticSearch Pods will be scheduled alone in a Node (because of the taint-toleration match) the JVM doesn’t have to share memory with other processes. Therefore, the heap size can comfortably be expanded to be close to the full amount of memory available to the Virtual Machine. The Pod memory requests and limits can also match these values since it’s guaranteed the Pods will be allowed to spawn in those specific Nodes.
Shard Count
One key factor that may affect the actual amount of memory to be allocated to the ElasticSearch cluster will be the total number of Shards required to be available.
Each Index consists of at least 2 Shards. The total number of Shards in the cluster is restricted by the amount of memory available, along with the Shard specific factors such as Shard size. It’s a good idea to calculate the rough number of Shards required in the cluster, the general memory foot print of each Shard and then plan the amount of memory to be available to the cluster. A general rule of thumb would be to calculate around 30 Shards per 1GB of RAM, however this could easily change with.
- the size of the documents indexed
- the frequency of document ingestion
- the frequency of index rotation
It should be noted that even with these considerations, the ElasticSearch cluster could still go OOM after a sudden, unexpected spike of input. This can be avoided by having necessary monitoring and alerting in place to know high memory usage in advance and scale the cluster as required.
To calculate the number of Shards required to be running on a cluster, a data retention strategy should be defined. Let’s discuss how to do so in another article.
Written on by .
Originally published on Medium