A design for a useful ELK deployment on K8s

Log aggregation in a K8s environment is something I have lightly touched upon previously in multiple occasions. However setting up a minimal but a reliable log aggregation stack on top of K8s could quickly become an evolutionary process with each step improving on the previous one (and of course, everyone thinks they can do log aggregation before they actually start to do so). The following is a pattern for ELK I came across while improving such a stack. While this pattern addresses most common requirements for a native K8s log aggregation stack, there could be better, more suitable patterns that you may have to consider when setting up solutions of your own.
- ElasticSearch on K8s: 01 — Basic Design
- ElasticSearch on K8s: 02 — Log Collection with Filebeat
- ElasticSearch on K8s: 03 - Log Enrichment with Logstash
- ElasticSearch on K8s: 04 - Log Storage and Search with ElasticSearch
- ElasticSearch on K8s: 05 - Visualization and Production Readying
- ElasticSearch Index Management
- Authentication and Authorization for ElasticSearch: 01 - A Blueprint for Multi-tenant SSO
- Authentication and Authorization for ElasticSearch: 02 - Basic SSO with Role Assignment
- Authentication and Authorization for ElasticSearch: 03 - Multi-Tenancy with KeyCloak and Kibana
Bird’s eye view
Problem
To discuss a solution, let’s first define a sample problem.
In our sample scenario, there is are one or more user managed (in contrast to provider managed) K8s clusters running on a popular Cloud Service Provider (ex: AWS EC2). The Nodes are created using different EC2 instance families. Deployment users (ex: infrastructure management team) has direct control over how the EC2 instances are managed.
There are different applications running on the K8s cluster across different namespaces. For some apps, multi-tenancy is implemented using K8s Namespaces as a basis, and some have multi-tenancy built-in to the code so that a single cluster of apps could be aware of multiple tenants acting on them.
The CNI could be the default flannel deployment or a more specialized customized deployment such as weave where network boundaries are implemented using NetworkPolicies.
Storage Classes are defined for the Cloud Service Provider provided persistence options (ex: EBS).
The logs generated by different apps in different Namespaces should be aggregated and indexed for analysis. The aggregated logs should be available for a predefined set of users with SSO through the chosen IDP for the deployment.
Solution
The solution for the above problem is a stack that looks logically similar to the diagram below. The responsibility of this stack of tools is to collect, enrich, store and provide convenient access to the logs.
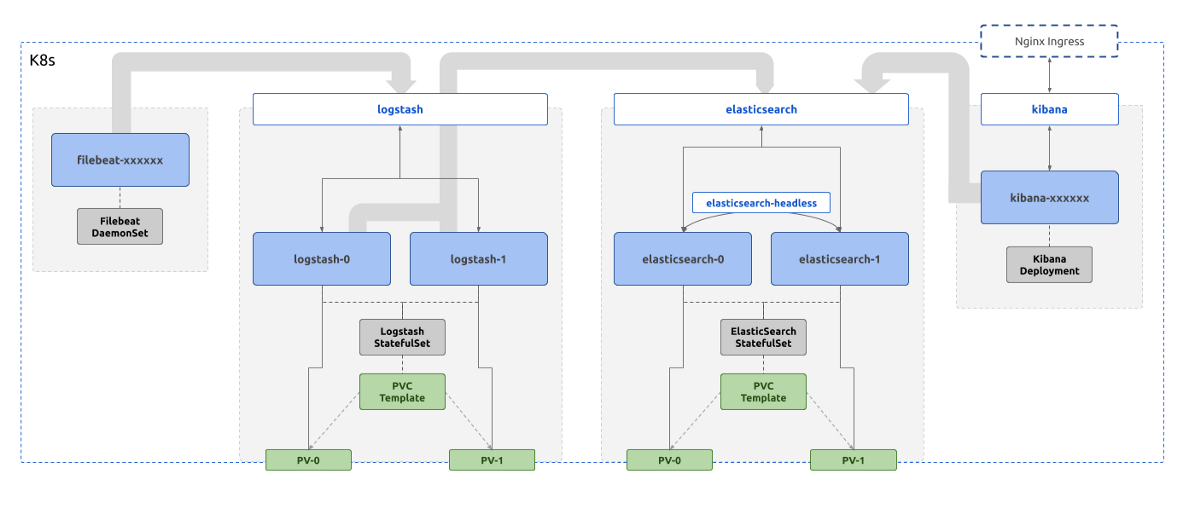
Each component of the stack are deployed in the same K8s cluster from where the logs are collected (this isn’t a must, a different controller K8s cluster could be used for log aggregation altogether).
In the above diagram, each blue box is a compute workload of the K8s native format Pod .
Their life cycles are controlled by various K8s native controller implementations, Deployment , StatefulSet , or DaemonSet . These controllers are represented by grey boxes.
The green boxes represent the K8s constructs that deal with data persistence. They include PersistentVolumes and PersistentVolumeClaimTemplates . They ultimately result in whatever the Cloud Service Provider specific implementations for storage, ex: EBS volumes for AWS.
The white boxes represent the networking constructs in K8s that act as consistent naming and service discovery, namely Services . Various types of Services are used in this deployment depending on the requirement, that could include load balancing, consistent naming, or reverse proxying.
Note that,
- Only Logstash and ElasticSearch processes need persistence
- Only Kibana is exposed to outside traffic
- ElasticSearch makes use of two types of Services
In addition to the above, there could be components that make authentication and authorization happen. To keep the scope of this article series simple, they are not included in the basic setup.
Let’s dive into the details of each component now to understand the function of each box in the above diagram and a few quirks of the design.
ELK Stack Components
A typical log collection stack consists of components for
- log collection
- log enrichment
- log storage and indexing
- visualization
While various tools offered by both Elastic and other vendors could work together in the above layers, most common tools used are,
- some kind of a Beats agent, ex: filebeat
- Logstash
- ElasticSearch
- Kibana
Let’s dive into each component and how they can be deployed on K8s in the next set of articles.
The configuration related to the stack being discussed in this article series will be available through a Github repository.
Written on September 19, 2019 by chamila de alwis.
Originally published on Medium