
This is part of a series of short articles on setting up an ELK deployment on K8s.
- ElasticSearch on K8s: 01 — Basic Design
- ElasticSearch on K8s: 02 — Log Collection with Filebeat
- ElasticSearch on K8s: 03 - Log Enrichment with Logstash
- ElasticSearch on K8s: 04 - Log Storage and Search with ElasticSearch
- ElasticSearch on K8s: 05 - Visualization and Production Readying
- ElasticSearch Index Management
- Authentication and Authorization for ElasticSearch: 01 - A Blueprint for Multi-tenant SSO
- Authentication and Authorization for ElasticSearch: 02 - Basic SSO with Role Assignment
- Authentication and Authorization for ElasticSearch: 03 - Multi-Tenancy with KeyCloak and Kibana
Log Collection
The typical task for a log collection tool is to collect a specified set of logs, from a specified set of locations, and offload them to a specified endpoint. Let’s explore these three aspects in detail.
1. Which logs to collect and how?
In a K8s environment, all logs of interest are generated as Docker Container logs that collect each Container’s stdout. These logs are persisted in the host node, typically in /var/lib/docker/containers/ folder.
Various tools have functionality OOTB that can collect logs entries from these Container log files. In Filebeat’s case it is a matter of specifying the type of input for collection as docker. What this does is to instruct Filebeat to collect the logs from the above mentioned Docker Container logs.
It should be noted that Elastic now favors
containertype todocker, however the input parameters are more or less the same.
There are additional options that can be used in order to modify the default behavior Filebeat uses to collect Docker logs. These include the containers.ids , containers.stream , and json . Filebeat documentation explains how these can be employed, however most defaults will do for the use case we are considering.
This configuration will start collecting the Docker Container logs. However the resulting log event will only consist of the data collected off from the log file itself. There are other information that could be collected at this moment that could be meaningful at the end of the pipeline. For an example, it’s important to understand which Pod produced a particular log line on which specific AWS instance containing a specific tag. Although it may be possible to enrich each log event later by means of correlation, Filebeat provides Processors to configure enrichment easily.
Two processors of importance in this setup are the Cloud Metadata Processor and the K8s Metadata Processor. Adding these to the configuration will make sure Cloud Service Provider specific details like the instance ID, region, and availability zone (collected by talking to the Cloud Service Provider metadata service), and K8s cluster specific details like originating Pod name, Pod labels and Namespace (collected by talking to the K8s Master API) are included in each resulting log event as Fields to be manipulated later (interestingly this is a form of log enrichment before we actually reach the tool designed to do log enrichment). These Fields will be highly useful to setup proper data segregation, search, and visualization.
2. Where to collect the logs from?
Now that how to collect logs is specified using a proper configuration, the locations to collect logs from has to be figured out.
In this case, Filebeat has to be run in background in the compute Nodes that are running K8s. This has to be a constantly running process that repeatedly polls the log files for new inputs.
We can start Filebeat as a typical Pod, may be as part of a Deployment. However, deploying Filebeat as a Deployment type opens up a critical hole in the design.
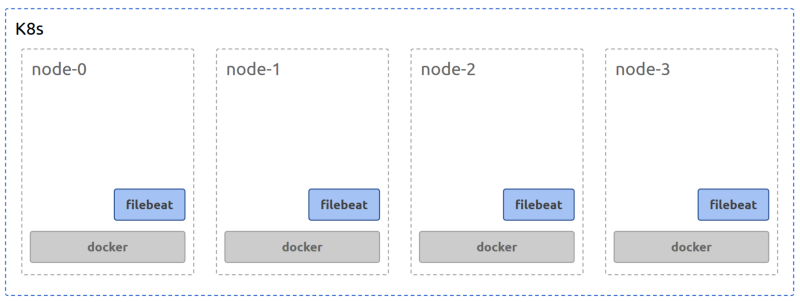
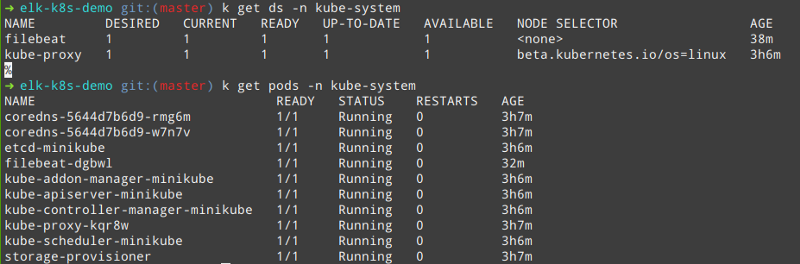
While a Deployment may schedule its Pods as it wishes, based on resource availability and other factors such as taints and tolerances, that would result in some compute Nodes not having a Filebeat Pod running in them to collect the Docker logs. To make sure that a Filebeat Pod is scheduled on each and every Node, another K8s construct called DaemonSet has to be used. A DaemonSet makes sure that the Filebeat Pods are scheduled in every Node with a count of 1. The resulting physical deployment should look like the following.
3. Where to send the collected logs to?
Now that how the logs should be collected and where log collection should happen are specified, the last piece of configuration to attach to the above is the destination for the logs that are read off from the Docker Container logs.
In our stack defined in the sample problem, this destination is the log enrichment layer, where Logstash is running. For Filebeat to publish logs to Logstash, the K8s Service for Logstash can be used. Because Filebeat is deployed in the kube-system Namespace in the sample code, Logstash will be in a different Namespace. Therefore, the FQDN of logstash.<namespaces>.svc.cluster.local has to be used to resolve the Service name correctly.
Or this Logstash could be part of a central Admin Cluster that hosts all the Ops and Administrative components of the stack. In that case, Logstash endpoint should be the publicly (or org-internally) resolvable URL. Note that, other than Filebeat, the log collection layer, all other layers of the stack could be part of a separate admin cluster.
The configuration including all of the above aspects that will be included in the filebeat.yml configuration file would look like the following.
    filebeat.inputs:
    - type: container
      paths:
        - /var/log/containers/*.log
      processors:
        - add_kubernetes_metadata:
            in_cluster: true
    processors:
      - add_cloud_metadata:
      - add_host_metadata:
    output.logstash:
      hosts: ["logstash.default.svc.cluster.local:5044"]
This is a slightly modified version of the configuration that is provided by Elastic. This is a minimal configuration matching a minimal requirement set. It’s highly likely this will require modification before getting adapted to specific deployments
There will be more configuration to set up for a proper production deployment requirement. These include,
- allowing Filebeat Pods to talk to the K8s Master API, and restricting the API calls to the specific set of endpoints and methods
- making sure Filebeat -> Logstash communication is allowed through the NetworkPolicy definitions
These concerns are not discussed in this article series as the requirements around them could be specific to each deployment.
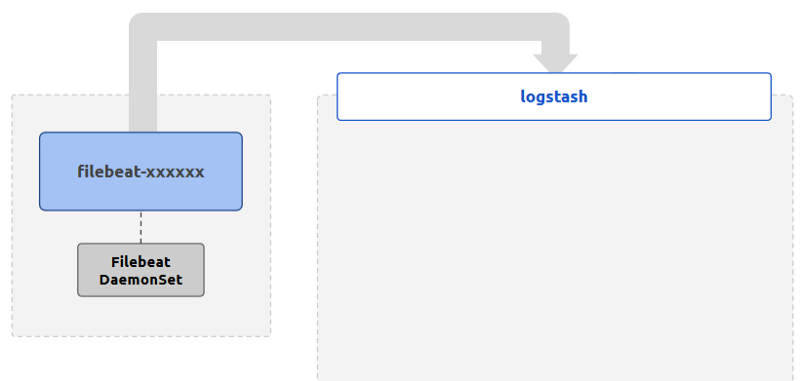
Following is the logical deployment and flow of data for the log collection layer.
Note that we have not specified any persistence for the Filebeat Pods. Since Filebeat only does log collection to be sent off to enrichment, and since the logs can be retrieved from the source if needed (during a limited period of time), Pods do not need a persistence layer to retrieve data in the case of crashes.
Let’s discuss the next step in the stack, log enrichment in the next article.
The configuration related to the stack being discussed in this article series will be available through a Github repository.
Written on September 21, 2019 by chamila de alwis.
Originally published on Medium