
Woolshed Hut on Mt. Somers
This is part of a series of short articles on setting up an ELK deployment on K8s.
- ElasticSearch on K8s: 01 — Basic Design
- ElasticSearch on K8s: 02 — Log Collection with Filebeat
- ElasticSearch on K8s: 03 - Log Enrichment with Logstash
- ElasticSearch on K8s: 04 - Log Storage and Search with ElasticSearch
- ElasticSearch on K8s: 05 - Visualization and Production Readying
- ElasticSearch Index Management
- Authentication and Authorization for ElasticSearch: 01 - A Blueprint for Multi-tenant SSO
- Authentication and Authorization for ElasticSearch: 02 - Basic SSO with Role Assignment
- Authentication and Authorization for ElasticSearch: 03 - Multi-Tenancy with KeyCloak and Kibana
Visualization
Kibana is a web application which can be used to query data from an ElasticSearch cluster. It does so through issuing queries to the ElasticSearch cluster through the REST API. Additionally it also acts as a widget and dashboard server that can be used to visualize specific queries, as well as a management frontend that can perform several actions like role and user management that are a lot cumbersome to do so through the ElasticSearch REST API. Kibana itself doesn’t have a requirement for persistence as it uses ElasticSearch itself as a persistence layer.
Being a web application, Kibana is the only tool out of this stack that has to be exposed to outside traffic in typical conditions (unless the ElasticSearch API is required to be exposed as well). Therefore, the attached kibana Service is linked to an Nginx Ingress which then can be exposed through a Cloud Service Provider load balancer.
Exposing the stack to outside traffic inevitably means that some kind of application level authentication and authorization will have to be put in place. This will be discussed in a future article.

Since there are no special requirements for scheduling when it comes to Kibana, a typical K8s Deployment can be used to spawn Pods. As it turns out, this will also be the layer with the lowest user generated load (mostly because Kibana will be used during the time of an abnormal behavior in the system to debug and troubleshoot, situations which ideally should be rare. Having the bulk of the effective load for a request performed at the ElasticSearch layer also helps to reduce the load on the visualization tool).
Furthermore, being stateless on its own (since ElasticSearch is its persistence), Kibana Pods can be scaled up and down as desired without having to worry about persistence requirement.
When Kibana is first started up, it checks for an ElasticSearch index named .kibana, and creates one if none is found. This is the index that should be persisted between cluster upgrades. This index stores all the Kibana specific settings and artifacts (called Saved Objects).
During high loads that may make ElasticSearch run out of resources, indices could get locked and marked as READ ONLY as a way to break input and stabilize the system. In this case the special system indices, including
.kibanacould also get locked. Unlocking these indices using the ElasticSearch API is an interesting exercise, highlighted by the fact that these lockouts occur during abnormal situations and you’re on Kibana just to try to figure out what’s going on in the first place.
Gluing the stack together
Now that we have discussed each tool of the stack in detail, let’s take a closer look at how these components interact with each other.
Looking back at the first diagram on the first post of this series which shows the complete logical deployment of the stack, the interactions between the components can be broken down to the following.
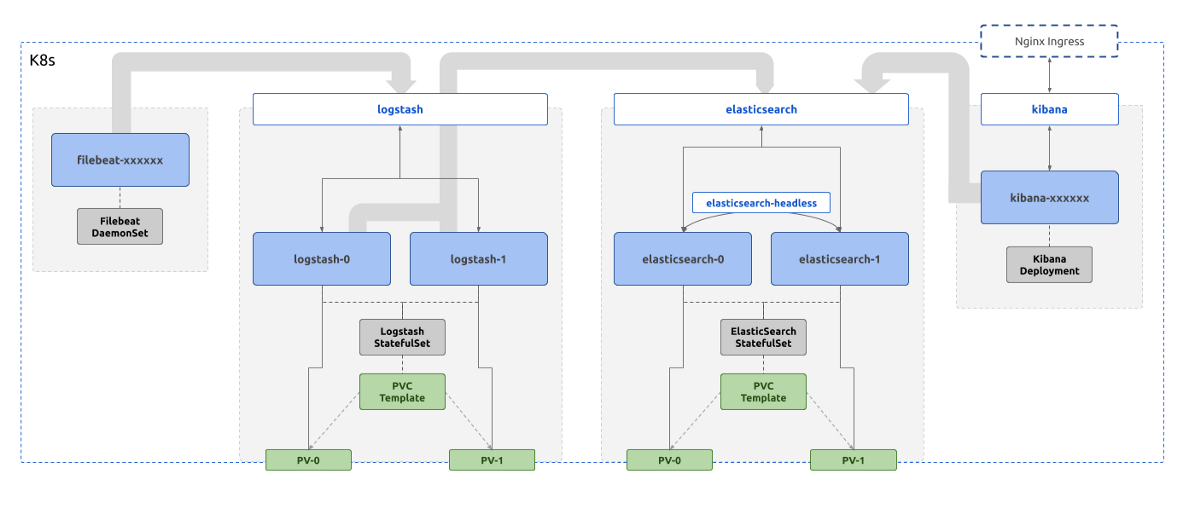
- Filebeat talks to Logstash through the K8s Service
logstashthrough port5066to push collected logs - Logstash talks to ElasticSearch through the K8s Service
elasticsearchthrough the port9200to push enriched logs - ElasticSearch nodes in the cluster talk to each other using the K8s Headless Service
elasticsearch-headlessand the consistent Pod names through the port9300to form and maintain the cluster - Kibana, when the user initiates access, talks to ElasticSearch through the K8s Service
elasticsearchthrough the HTTP port9200to read and write data
The definitions of the Services mentioned above should reflect this by exposing the correct ports for communication. Furthermore, any NetworkPolicy definitions in place should also allow ingress and egress traffic from the parties defined in the above interactions.
For an example, when considering the interactions #2, #3, and #4, the NetworkPolicy attached to the ElasticSearch Pods should allow ingress traffic to port 9200 originating from labels attached to both Logstash and Kibana Pods. On the other hand, it should also restrict traffic to port 9300 so that only traffic originating from labels attached ElasticSearch.
kibana Service should be exposed to outside traffic using an Nginx Ingress and attached Cloud Service Provider load balancers. The port that the Service should expose is 5601 .
The above considerations should take care of most of the issues in connectivity between the Pods of the stack. However, this stack would not be ideal to be left out in the production environment. There will be layers that will easily buckle before sudden spikes or consistent high loads. They should be hardened in terms of fault tolerance.
Production Hardening
01: Buffering at Logstash Layer
Filebeat and Logstash are essentially the content input and transformation layers of the stack. Therefore, naturally, the first line of defense against unwanted levels of input should be implemented at these layers. Implementing this at Filebeat could be simpler, by for example, excluding file patterns that may produce a large number of log lines per second. However that is not a proper adaptive defense against sources that unexpectedly send too large inputs, that otherwise may produce meaningful data. Therefore, it may be better to keep the complexity of buffering input away from Filebeat.
Disk Based Buffering for Incoming Events
Logstash on the other hand could get affected first by a spike of input. “Persistent Queues” (PQs) is a built-in feature for Logstash to tackle this exact problem. In brief, Logstash instances with PQs enabled will keep a configurable file based buffer (instead of a fixed in-memory buffer) for incoming events to be processed. Events will clear this buffer only after being fully processed (i.e. going through filter and/or output stages, based on ACKnowledging the event to Filebeat as processed). If the buffer is filled at a certain points (ex: by a spike of inputs from one of the Filebeat instances) that Logstash instance will stop accepting events for processing, until the buffer is cleared to queue more input. This method of back-pressuring inputs lets Logstash gracefully fail during a spike, without dropping events.
PQs can be configured to have both a maximum event count and a maximum size on disk. Therefore, the buffer size can be experimented with to have the optimum size for managing back-pressure in a sensible manner.
For PQs, durability is important, and therefore, storing the PQs on a Pod storage, which does not survive Pod lifecycles, defeats the purpose. PQs should be complemented with Persistent Storage for Logstash. The easiest way to handle this is to convert the Logstash K8s Deployment to a StatefulSet with a PersistentVolumeClaimTemplate . This will make sure that PQs are stored in volumes that will not go down with the Pod or even the StatefulSet controller. This is the reason why Logstash component is portrayed as a StatefulSet managed set of Pods in the initial diagram.

Throttling Events at Logstash
The above method of disk based buffering is only half of the work that can be done to throttle input at the Logstash layer. Provided that we have an understanding of the wanted and unwanted events, we can restrict the load on the stack furthermore. This is an active method of throttling as opposed to the passive buffering method described above. During buffering, the events that are not acked by Logstash will be tried again by Filebeat later. With throttling, the unwanted events are typically dropped and will not be evaluated again (unless otherwise fed again into the Logstash pipeline. This however will be rare since use of throttling will mostly happen for unwanted events).
How throttling is done at Logstash is using the Throttle Filter. It defines a window based on the number of events passing through the filter, so that events outside that window are throttled. This window is defined by the properties, before_count and after_count. This window is reset from time to time, which is also configurable using properties period and max_age. Furthermore, the throttle filter can be selectively applied for sources that are only likely to produce spikes of data. There could be multiple such window counters based on a key that is defined to separate events into diffeerent buckets.
For an example, to only allow a maximum of 1000 events from a single webapp Pod per minute, we can define a throttle filter like the following.
if [kubernetes][labels][app] in ["webapp"] {
  throttle {
    after_count => 1000
    key => "%{kubernetes.pod.name}"
    period => 60
    max_age => 120
    add_tag => "throttled"
  }
}
- The throttle filter is only engaged for events from the
webapplabelled Pods - Throttling is engaged after a maximum of 1000 event counts
- A window is defined per Pod name
- The window is reset after 60 seconds
- Each event that gets throttled is applied a tag named
throttled
Based on this information, we can choose to drop any throttled event.
if "throttled" in [tags] {
  drop {}
}
It’s also possible to get the number of events throttled to get more visibility into the throttling functionality using a Metrics Filter.
02: Keeping ElasticSearch Separate
As mentioned in another post in this series, ElasticSearch is the most resource intensive of the tools of this stack. Therefore, it is important to make sure that ElasticSearch Pods are getting adequate resources allocated to it and other non-related workloads are not affecting their performance drastically.
The ideal way to do this is to make sure that
- ElasticSearch Pods are scheduled into special types of Nodes with resources matching required performance
- Other workloads are not getting scheduled in those special types of Nodes
The K8s native way to implement this is through taints and tolerations. The idea is to
- Spawn special VM Nodes to match the Pod replica count (ex: 2 in the sample case)
- Mark the Nodes with a taint which is a key-value label
- Mark the
elasticsearchStatefulSet with tolerations that match the taint added to the Nodes
This will make sure that only elasticsearch Pods that carry the matching tolerations, will get scheduled to the tainted Nodes.
For an example, the Nodes that are supposed to host the ElasticSearch Pods can be tainted with the following.
kubectl taint nodes elasticsearch-node-01 role=elasticsearch:NoSchedule
kubectl taint nodes elasticsearch-node-02 role=elasticsearch:NoSchedule
The elasticsearch StatefulSet should get the following tolerations.
tolerations:
  - key: "role"
    operator: "Equal"
    value: "elasticsearch"
    effect: "NoSchedule"
After this change is done the Nodes will only carry the required kube-system Pods and elasticsearch-* Pods that match the tolerations. However, Filebeat Pods should also be scheduled in these Nodes for log collection to be completed. Therefore, the above tolerations that were added to ElasticSearch StatefulSet should also be added to the Filebeat DaemonSet.

With this change, it’s important to make sure that PVs that are to be attached to the ElasticSearch Pods are spawned on the same regions as the targeted Nodes. This should be done by either matching the zones that the PVs will be spawned with the zones that ElasticSearch Nodes will be spawned in, or making sure that PVs are not spawned until the requests to spawn them are made. The first can be done by defining a
StorageClasswith the provisioner set to the required one (ex:gp2) and usingallowedTopologiesto match the zones. How to achieve the latter is to define a customStorageClasswith thevolumeBindingModeflag set toWaitForFirstConsumer. If such a step is not taken, there will be scenarios whereelasticsearchPods will be restricted to Nodes that do not have PVs spawned in that respective zone, failing the scheduling phase.
03: Managing ElasticSearch JVM Parameters
ElasticSearch is a JVM. Being a memory intensive tool, it should be allocated enough memory so that
- the frequency of Garbage Collection is as less as possible
- the Garbage Collection pause is as short as possible
The JVM memory sizes (minimum and maximum) can be set through the use JVM configuration options provided by ElasticSearch. The exact values to set may vary on the type of the use. However as a best practice,
- match minimum and maximum heap sizes (
XmsandXmx) to reduce GC frequency early in the process uptime - match the Pod memory requests and limits to the heap size
Since ElasticSearch Pods will be scheduled alone in a Node (because of the taint-toleration matching mentioned above) the JVM doesn’t have to share memory with other processes. Therefore, the heap size can comfortably be expanded to be close to the full amount of memory available to the Virtual Machine. The Pod memory requests and limits can also match these values since it’s guaranteed the Pods will be allowed to spawn in those specific Nodes.
04: Shard Count
One key factor that may affect the actual amount of memory to be allocated to the ElasticSearch cluster will be the total number of Shards required to be available.
Each Index consists of at least 2 Shards if default settings are used. The total number of Shards in the cluster is restricted by the amount of memory available, along with the Shard specific factors such as Shard size. It’s a good idea to calculate the rough number of Shards required in the cluster, the general memory foot print of each Shard and then plan the amount of memory to be available to the cluster. A general rule of thumb would be to calculate around 30 Shards per 1GB of RAM, however this could easily change with.
- the size of the documents indexed
- the frequency of document ingestion
- the frequency of index rotation
It should be noted that even with these considerations, the ElasticSearch cluster could still go OOM after a sudden, unexpected spike of input. This can be avoided by having necessary monitoring and alerting in place to know high memory usage in advance and scale the cluster as required.
To calculate the number of Shards required to be running on a cluster, a data retention strategy should be defined. Let’s discuss how to do so in another article.